SPSS appendix til slides
1 Datasæt
All datasets are available from http://publicifsv.sund.ku.dk/~sr/BasicStatistics/datasets/.
1.1 Vitamin D
We consider a study investigating how the level of vitamin D depends on BMI. We have data from a group of elderly women in Finland and Poland. The data are described in detail in Andersen et al. (2005) ‘Teenage girls and elderly women living in northern Europe have low winter vitamin D status’, European Journal of Clinical Nutrition.
Low vitamin D status contributes to declining bone mass and thereby increased incidence of hip fractures in elderly. To assess vitamin D status, the concentration of serum 25-hydroxyvitamin D (S-25OHD) is considered as an accurate and integrative measure reflecting an individual’s intake and cutaneous production of vitamin D.
Variables:
- country (1=DK, 2=FI, 4=EI, 6=PO)
- vitd (nmol/L, serum Vitamin D level)
- age (years)
- bmi \(({\rm kilo/m}^2)\)
- sunexp (1=Avoid sun, 2=Sometimes in sun, 3=Prefer sun)
- vitdintake (Vitamin D intake, the amount of vitamin D contained in the consumed food)
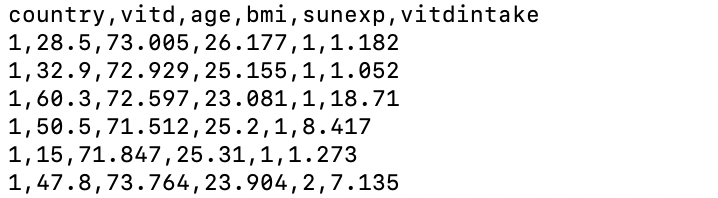
Data is available in the file vitamin.txt from http://publicifsv.sund.ku.dk/~sr/BasicStatistics/datasets/. A snapshot of the data shows that the values are separated by commas, the decimal symbol is a period, variable names are given in the first row:
Download the data file to a folder on your computer and load the data in to SPSS (see how in SPSS intro on data import).
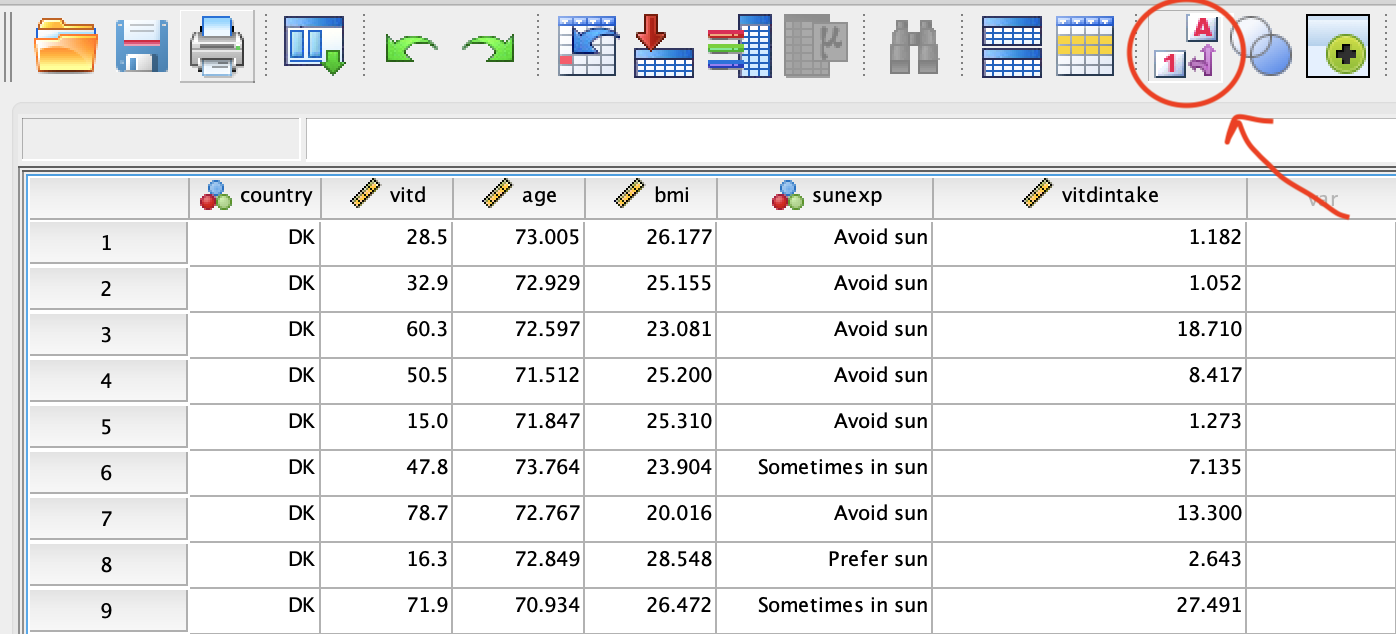
Add labels to the values of categorial variables (country and sunexp) in order to remember the codings (see how in SPSS intro adjusting the properties of the variables. The data in Variable View should look like (press the button with the red circle to have value labes shown instead of the original values of the variables):